One of the strangest experiences in affiliate marketing happens the first time you open your dashboard.
You expect clarity.
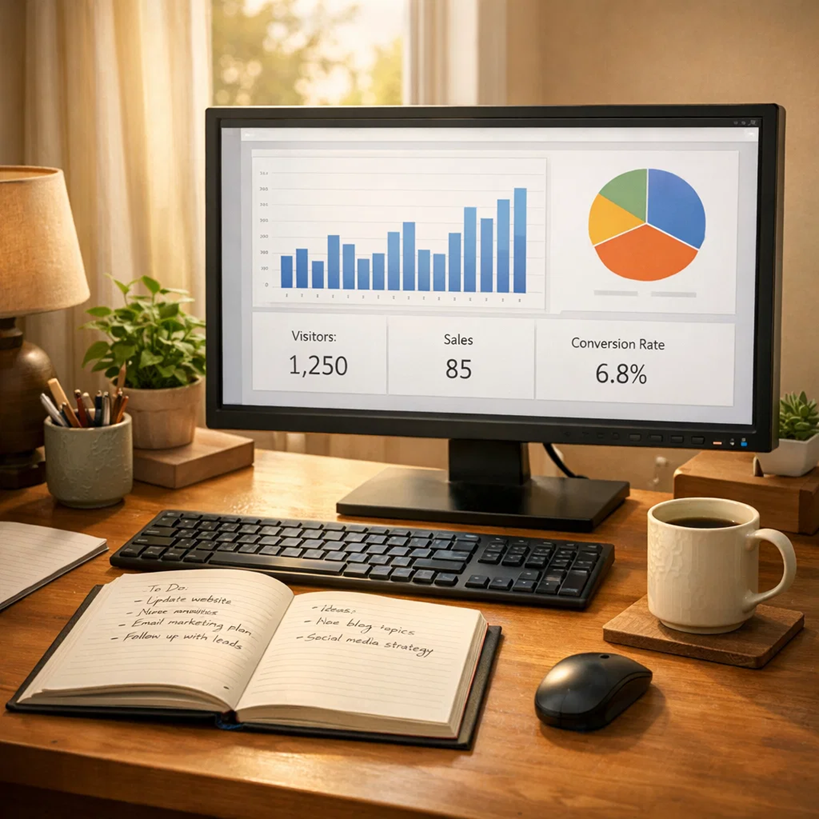
Instead you get numbers.
Clicks, impressions, conversions, EPC, CR, revenue, pending, approved, refunded. Sometimes graphs that move. Sometimes graphs that refuse to move at all.
And suddenly you are staring at data trying to figure out what it means about you.
Most beginners do not quit because they cannot learn marketing.
They quit because they misinterpret feedback.
They assume every number is a verdict instead of a signal.
Today we simplify it.
You do not need to become an analyst to grow online. You just need to know which numbers matter right now and which ones you can safely ignore.
The Problem With Dashboards
Affiliate dashboards are designed for affiliates at every level.
That means they show advanced metrics long before they become useful to beginners.
So people do this:
They refresh the dashboard constantly.
They analyze tiny sample sizes.
They draw conclusions from almost no data.
Then they change everything.
New offer. New niche. New strategy. New platform.
The dashboard becomes a source of anxiety instead of guidance.
The truth is most dashboards only have three useful signals early on.
Everything else becomes helpful later.
Stage One: You Are Measuring Movement, Not Profit
At the beginning, your goal is not income.
Your goal is proof of motion.
So ignore revenue for now. It will distort your thinking.
Instead watch these three metrics:
1. Clicks
Are people actually reaching the offer?
If there are no clicks, the offer is not the issue. The traffic path is.
You are solving a connection problem, not a persuasion problem.
2. Opt ins or leads
Are people entering your funnel or email list?
If traffic exists but nobody joins, the page needs clarity. Not hype. Not redesigns. Just clarity.
3. Time consistency
Did activity happen more than once?
One click means nothing. Ten clicks across multiple days means direction.
Early dashboards are not about success or failure.
They are about whether your system is alive.
Why Beginners Overreact to Zero Sales
Here is the most common mistake.
Someone gets 12 clicks and no sales.
They assume the offer does not convert.
But offers are not tested with 12 people.
They are tested with hundreds.
At low traffic levels, randomness dominates outcomes.
So people replace offers instead of improving flow.
This creates a loop:
Change strategy → reset learning → never gather real data.
Your first objective is stability.
Let data accumulate before interpreting it.
The Only Question That Matters Early
When you open your dashboard, do not ask:
“Did I make money today?”
Ask:
“Did the system run today?”
Did someone click?
Did someone join?
Did the page load correctly?
Did traffic reach the right place?
If yes, your job is repetition.
Income grows from repetition, not interpretation.
Understanding EPC Without Letting It Control You
You will eventually see EPC, earnings per click.
This number scares beginners because they think it predicts their future income.
It does not.
EPC is an average across many affiliates, traffic sources, audiences, and skill levels.
It tells you potential range, not guaranteed outcome.
Early on, your personal EPC will swing wildly because your traffic volume is tiny.
So do not judge yourself against platform averages yet.
Your dashboard is not comparing you to others.
It is comparing you to your previous attempts.
The Signal Ladder
Think of your dashboard as a ladder. Each step unlocks the next question.
Step 1: Are people arriving?
Step 2: Are they interested enough to continue?
Step 3: Are they trusting enough to act?
Step 4: Are they buying?
Most beginners jump straight to step 4.
But dashboards only make sense when read in order.
If nobody reaches step 1 consistently, step 4 is irrelevant.
What To Do After Checking Your Dashboard
This part matters more than the numbers.
After reading the dashboard, take one action only.
Not five.
Not a redesign.
One adjustment.
Examples:
Low clicks → improve traffic source consistency
Low opt ins → clarify page message
Low conversions → add explanation content
Then leave it alone long enough for data to exist.
The dashboard rewards patience more than cleverness.
A Healthier Way To Think About Data
Instead of treating the dashboard as a report card, treat it as a conversation.
You did something.
The system responded.
Now you respond back.
The goal is not perfect decisions.
The goal is small corrections over time.
People who succeed online rarely have perfect insight.
They simply allow information to accumulate before reacting.
Why Simplicity Wins
You do not need complicated analytics in the beginning.
You need a stable loop:
Traffic → Page → Follow up → Repeat
The dashboard only confirms whether the loop is functioning.
When the loop works, scale becomes logical.
When the loop breaks, adjustments become obvious.
Without overthinking.
One Last Perspective
Your first dashboards will look unimpressive.
Almost empty.
That is normal.
They are not showing failure.
They are showing the earliest traces of a system being built.
Read them lightly.
Act consistently.
Give them time to become meaningful.
Because dashboards do not create results.
Repeated behavior does.